


Deepnote – A Less Celebrated and Used AI-Based Data Analysis and ML Tool That Can Make Your Life a Lot Easier
While learning and playing with ML everyday, I found this Deepnote app very interesting. We all have data to clean and we may have data from different sources and different databases. This tool is so interactive that you can pull data from sources with plugins, load multiple CSVs, and do interactive visualizations—and AI helps you write code there.
1. What is Deepnote?
Deepnote is a cloud-based notebook platform designed for data science and machine learning projects. It shares similarities with Jupyter notebooks but introduces several enhancements that improve the experience:
- AI Integration: Deepnote includes AI-assisted code suggestions, helping you scaffold code snippets and giving tips on best practices.
- Collaboration: It offers real-time collaboration, making it easy for teams to work on a single notebook simultaneously.
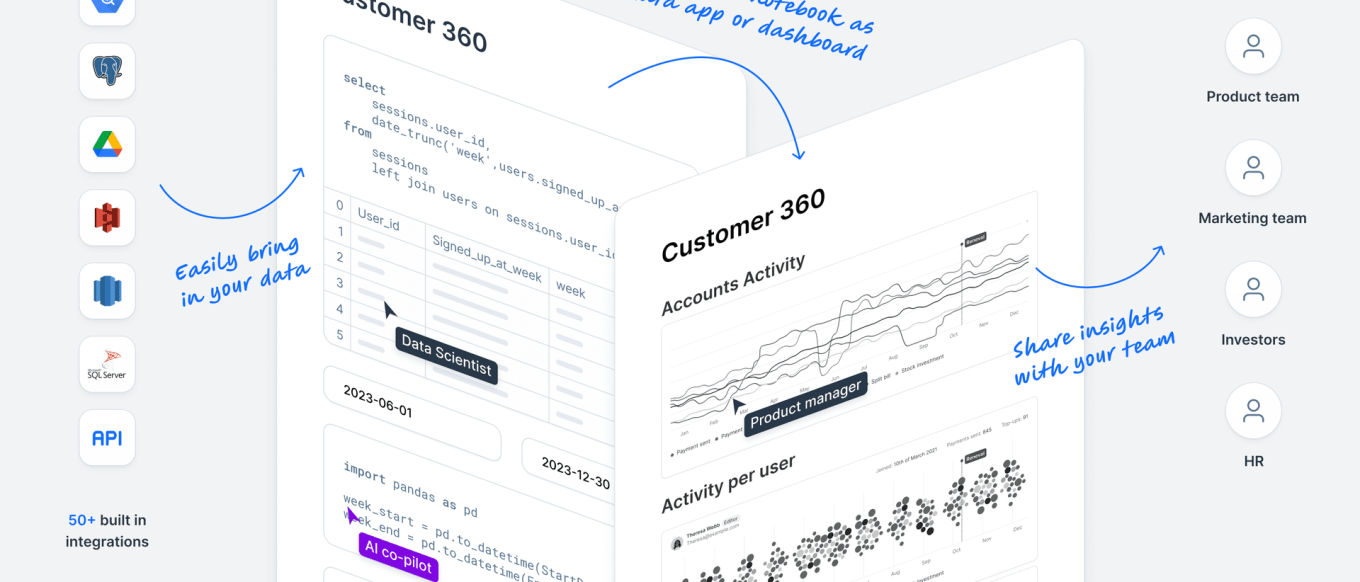
- Data Source Integration: Connect your notebook to databases, data warehouses, and external APIs with minimal effort.
- Interactive Visualizations: Quickly generate charts, dashboards, and other visual insights in a user-friendly interface.
2. Why Use Deepnote for Data Analysis and ML?
- User-Friendly Interface: Deepnote’s design is intuitive, making it simpler to run code, manage files, and visualize outputs. You can switch between code cells, markdown cells, and various visualizations seamlessly.
- Collaboration: It’s built for collaboration, similar to Google Docs. Multiple team members can work in the same notebook at the same time—no merging conflicts or version mismatches.
- AI-Powered Code Suggestions: One of Deepnote’s standout features is its built-in AI assistant, which can help write and complete code snippets. If you’re stuck or looking for a more efficient solution, you can use the AI for hints and optimization suggestions.
- Ease of Data Integration: With plugins and built-in connectors, you can easily pull data from sources like PostgreSQL, BigQuery, or Amazon S3. You can also upload multiple CSV files from your local machine directly.
- Scalability and Performance: Depending on your plan, you can leverage more powerful compute resources for larger projects, scaling your notebooks to handle big data tasks.
3. Getting Started with Deepnote
3.1 Signing Up
-
Visit Deepnote’s website and sign up for a free account. You can sign up using your GitHub, Google, or email.
-
Create Your Workspace: Workspaces are where your projects live. If you’re collaborating with a team, you can invite them to your workspace and share notebooks easily.
3.2 Creating a New Project
-
Click “Create a project”: Name your project (e.g., My First Deepnote Project).
-
Choose a Template or Start from Scratch: Deepnote offers templates for common tasks (like data visualization, data cleaning, or machine learning). You can start with one of these if it fits your use case, or create an empty project.
4. Tutorial: Data Cleaning and Simple ML Example
4.1 Loading Multiple CSV Files
-
Upload your CSV files: In the left sidebar, find the Files section. Drag and drop your CSV files or click “Upload files.”
-
(Alternatively) Connect a Database: Deepnote supports connectors to various databases. For instance, if you want to connect to a PostgreSQL database, you can go to the “Add Integration” option and select PostgreSQL, then enter your credentials.
For this example, let’s say we have two CSV files:
products.csv: Contains information about different products with columns likeproduct_id,name,category,price.sales.csv: Contains sales transactions with columns liketransaction_id,product_id,quantity_sold,transaction_date.
Sample Code Snippet
import pandas as pd

# Load the data
products_df = pd.read_csv('products.csv')
sales_df = pd.read_csv('sales.csv')

# Quick check of the data
print(products_df.head())
print(sales_df.head())
4.2 Merging and Cleaning the Data
Next, we’ll merge the two DataFrames on product_id. Suppose we want to keep all sales records, and match each sale to the product details.
merged_df = pd.merge(sales_df, products_df, on='product_id', how='left')

# Check for missing values
print(merged_df.isnull().sum())
If you find missing values, you can decide to drop them or fill them:
merged_df = merged_df.dropna(subset=['product_id']) # For example, drop rows where product_id is missing4.3 Exploratory Data Analysis (EDA)
One of the advantages of Deepnote is the built-in interactive charts. You can either use Python libraries like matplotlib or seaborn or use the integrated visualization features.
Example 1: Sales by Category
import seaborn as sns
import matplotlib.pyplot as plt

sales_by_category = merged_df.groupby('category')['quantity_sold'].sum().reset_index()

plt.figure(figsize=(8,4))
sns.barplot(data=sales_by_category, x='category', y='quantity_sold')
plt.title('Total Quantity Sold by Category')
plt.xticks(rotation=45)
plt.tight_layout()
plt.show()
With Deepnote’s interactive interface, you could also create a chart by clicking on the DataFrame’s visualization tools directly, selecting the appropriate axes, and letting Deepnote generate the chart.
4.4 Building a Simple ML Model
To illustrate machine learning capabilities, let’s assume we want to predict whether a product’s sales will be above or below a certain threshold in a given month. This is a binary classification problem.
- Feature Engineering: For simplicity, let’s create a feature called
total_sales_last_monthfor each product. - Binary Target: We’ll create a column called
high_saleswhich is1ifquantity_soldin the current month is above 100, otherwise0.
import numpy as np

# Suppose the dataset has a 'month' column that indicates the month of the transaction
# We will aggregate sales data for each product, for each month

monthly_sales = merged_df.groupby(['product_id', 'month'])['quantity_sold'].sum().reset_index()

# Feature: total sales in the previous month
monthly_sales['previous_month_sales'] = monthly_sales.groupby('product_id')['quantity_sold'].shift(1)

# Binary target: high_sales
monthly_sales['high_sales'] = np.where(monthly_sales['quantity_sold'] > 100, 1, 0)

# Drop rows where we don’t have previous month sales
monthly_sales = monthly_sales.dropna(subset=['previous_month_sales'])

print(monthly_sales.head())
Train/Test Split:
from sklearn.model_selection import train_test_split

X = monthly_sales[['previous_month_sales']]
y = monthly_sales['high_sales']

X_train, X_test, y_train, y_test = train_test_split(X, y, test_size=0.2, random_state=42)
Training a Simple Model:
from sklearn.ensemble import RandomForestClassifier
from sklearn.metrics import accuracy_score

model = RandomForestClassifier(n_estimators=100, random_state=42)
model.fit(X_train, y_train)

y_pred = model.predict(X_test)
acc = accuracy_score(y_test, y_pred)
print(f'Accuracy: {acc:.2f}')
4.5 AI-Powered Suggestions
If you’re unsure about code syntax or best practices, Deepnote’s AI assistant can offer prompts. For example, you could start typing from sklearn.... and the AI can suggest the correct library import statements or model building steps. It’s especially handy for repetitive tasks like EDA or feature engineering.
5. Interactive Visualizations
Deepnote shines in creating quick, interactive dashboards. You can pin outputs (like charts or data tables) to a side panel or a dedicated dashboard page. This is helpful when you want to share live results with stakeholders who might not be coding experts—they can just look at the interactive visuals or the pinned results, without ever having to run code cells.
Tip: If you find yourself repeatedly creating the same visual, consider building a small dashboard within Deepnote. This can include:
- Widgets for filtering data by month or category.
- Auto-updating charts whenever your DataFrame changes.
6. Collaboration and Version Control
Deepnote integrates with GitHub, allowing you to commit changes directly from the notebook. You can also invite collaborators to your project so they can view or edit the notebook in real-time. Each change is tracked, which makes it easy to revert to an earlier version if needed.
The Future of Automated Data Analysis
Deepnote offers a powerful yet understated environment for data analysis, machine learning, and collaboration. Its user-friendly interface, AI code suggestions, and flexible integrations make it an excellent choice for individuals and teams looking to streamline their workflows.
If we had agentic AI here to do all the processing over a lot of disorganized data and it does everything by itself and gives us the report, that would be crazy — but I hope one day they will implement something like this.
Until that day comes, Deepnote remains an impressive platform, well-suited for hands-on data wrangling, exploration, and model building. If you haven’t tried it yet, now is a great time to explore the possibilities it offers. You might just find that it makes your data science journey a whole lot easier!